Visualization
pyannote.core.Segment, pyannote.core.Timeline,
pyannote.core.Annotation and pyannote.core.SlidingWindowFeature
instances can be directly visualized in notebooks.
You will however need to install pyannote.core’s additional dependencies
for notebook representations (namely, matplotlib):
pip install pyannote.core[notebook]
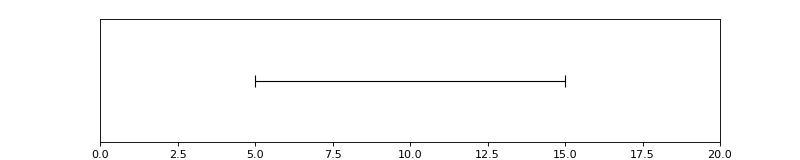
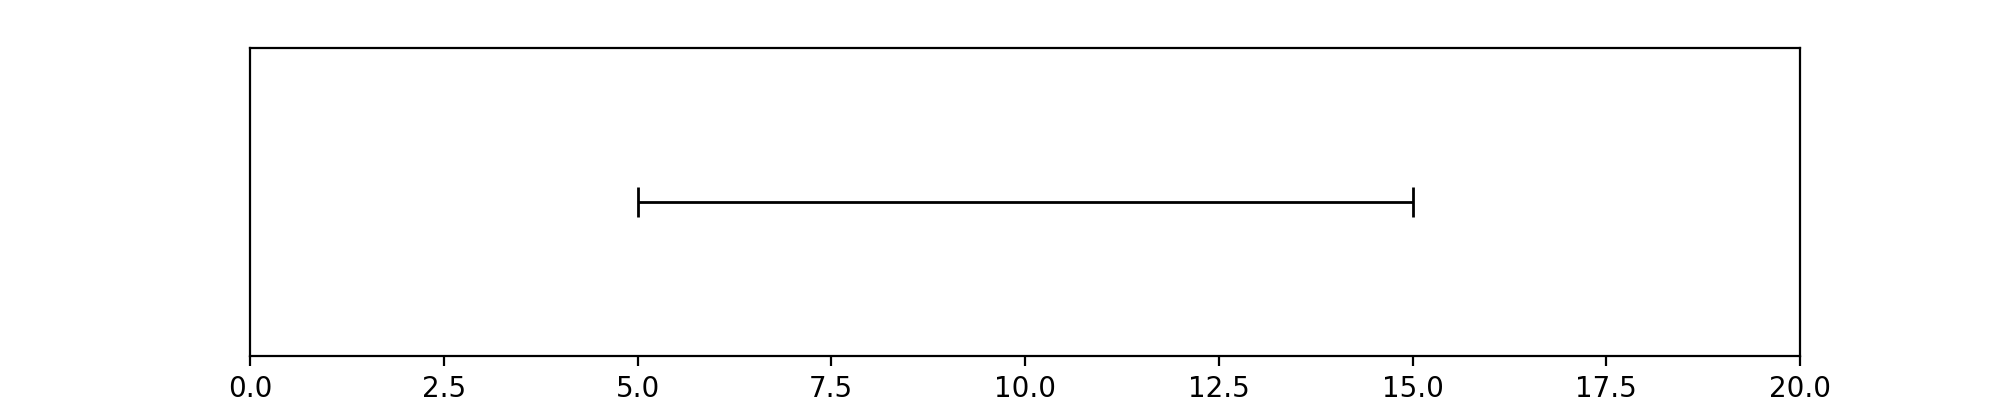
Segments
In [1]: from pyannote.core import Segment

In [2]: segment = Segment(start=5, end=15)
  ....: segment
(Source code, png, hires.png, pdf)

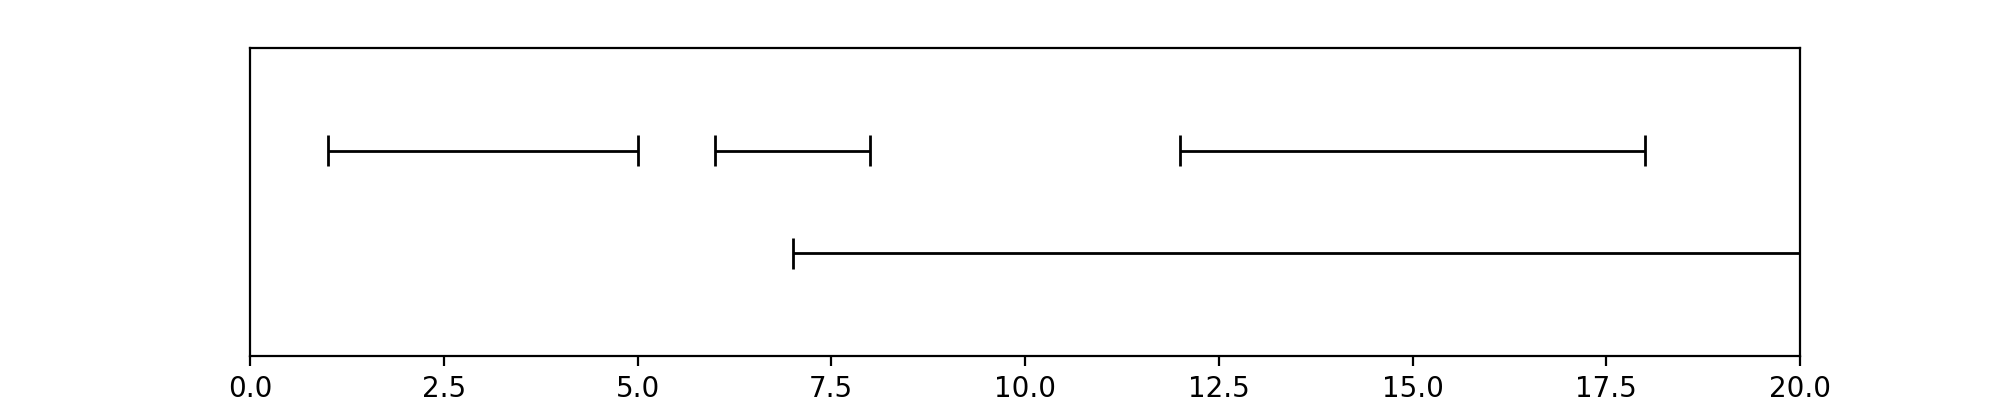
Timelines
In [25]: from pyannote.core import Timeline, Segment

In [26]: timeline = Timeline()
   ....: timeline.add(Segment(1, 5))
   ....: timeline.add(Segment(6, 8))
   ....: timeline.add(Segment(12, 18))
   ....: timeline.add(Segment(7, 20))
   ....: timeline
(Source code, png, hires.png, pdf)

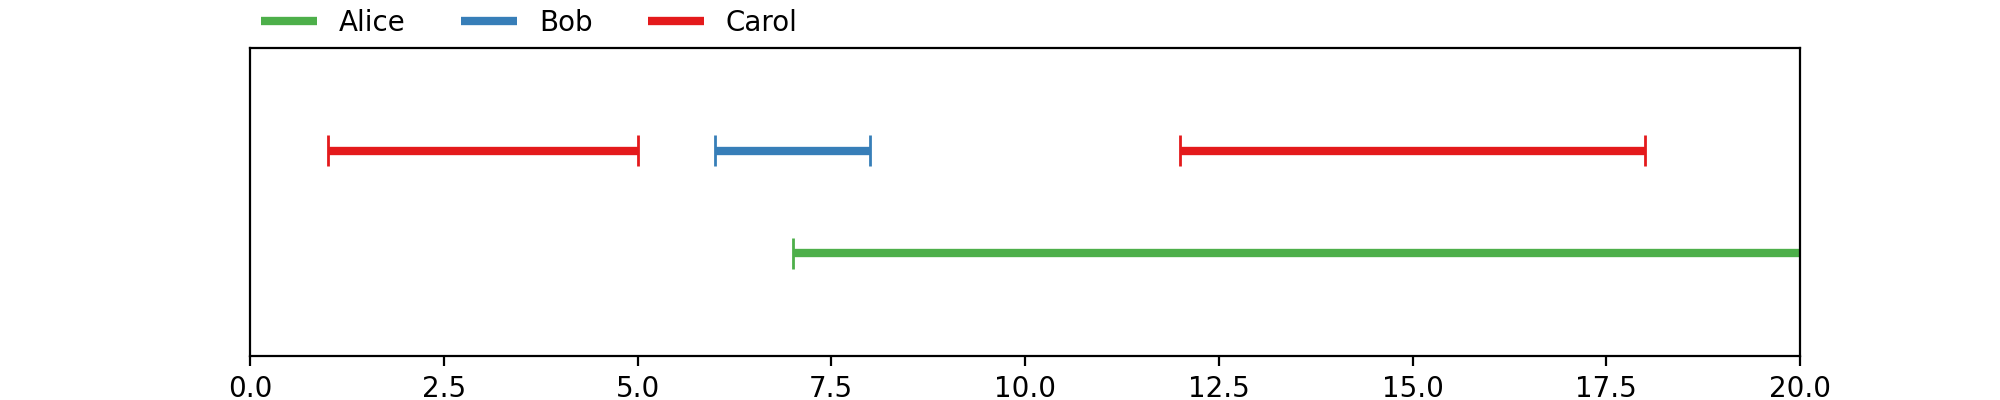
Annotations
In [1]: from pyannote.core import Annotation, Segment

In [6]: annotation = Annotation()
   ...: annotation[Segment(1, 5)] = 'Carol'
   ...: annotation[Segment(6, 8)] = 'Bob'
   ...: annotation[Segment(12, 18)] = 'Carol'
   ...: annotation[Segment(7, 20)] = 'Alice'
   ...: annotation
(Source code, png, hires.png, pdf)
