Reference
Evaluation metrics
Here is a typical speaker diarization pipeline:
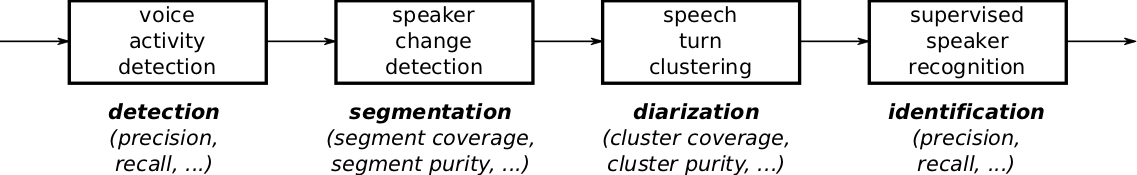
The first step is usually dedicated to speech activity detection, where the objective is to get rid of all non-speech regions. Then, speaker change detection aims at segmenting speech regions into homogeneous segments. The subsequent clustering step tries to group those speech segments according to the identity of the speaker. Finally, an optional supervised classification step may be applied to actually identify every speaker cluster in a supervised way.
Looking at the final performance of the system is usually not enough for diagnostic purposes. In particular, it is often necessary to evaluate the performance of each module separately to identify their strengths and weaknesses, or to estimate the influence of their errors on the complete pipeline.
Here, we provide the list of metrics that were implemented in pyannote.metrics with that very goal in mind.
Because manual annotations cannot be precise at the audio sample level, it is common in speaker diarization research to remove from evaluation a 500ms collar around each speaker turn boundary (250ms before and after). Most of the metrics available in pyannote.metrics support a collar parameter, which defaults to 0.
Moreover, though audio files can always be processed entirely (from beginning to end), there are cases where reference annotations are only available for some regions of the audio files. All metrics support the provision of an evaluation map that indicate which part of the audio file should be evaluated.
Detection
The two primary metrics for evaluating speech activity detection modules are detection error rate and detection cost function.
Detection error rate (not to be confused with diarization error rate) is defined as:
where \(\text{false alarm}\) is the duration of non-speech incorrectly classified as speech, \(\text{missed detection}\) is the duration of speech incorrectly classified as non-speech, and \(\text{total}\) is the total duration of speech in the reference.
Alternately, speech activity module output may be evaluated in terms of detection cost function, which is defined as:
where \(\text{false alarm rate}\) is the proportion of non-speech incorrectly classified as speech and \(\text{miss rate}\) is the proportion of speech incorrectly classified as non-speech.
Additionally, detection may be evaluated in terms of accuracy (proportion of the input signal correctly classified), precision (proportion of detected speech that is speech), and recall (proportion of speech that is detected).
- class pyannote.metrics.detection.DetectionAccuracy(collar: float = 0.0, skip_overlap: bool = False, **kwargs)[source]
Detection accuracy
This metric can be used to evaluate binary classification tasks such as speech activity detection, for instance. Inputs are expected to only contain segments corresponding to the positive class (e.g. speech regions). Gaps in the inputs considered as the negative class (e.g. non-speech regions).
It is computed as (tp + tn) / total, where tp is the duration of true positive (e.g. speech classified as speech), tn is the duration of true negative (e.g. non-speech classified as non-speech), and total is the total duration of the input signal.
- Parameters:
- compute_components(reference: Annotation, hypothesis: Annotation, uem: Timeline | None = None, **kwargs) Dict[str, float][source]
Compute metric components
- Parameters:
reference (type depends on the metric) – Manual reference
hypothesis (same as reference) – Evaluated hypothesis
- Returns:
components – Dictionary where keys are component names and values are component values
- Return type:
- class pyannote.metrics.detection.DetectionCostFunction(collar=0.0, skip_overlap=False, fa_weight=0.25, miss_weight=0.75, **kwargs)[source]
Detection cost function.
This metric can be used to evaluate binary classification tasks such as speech activity detection. Inputs are expected to only contain segments corresponding to the positive class (e.g. speech regions). Gaps in the inputs considered as the negative class (e.g. non-speech regions).
Detection cost function (DCF), as defined by NIST for OpenSAT 2019, is 0.25*far + 0.75*missr, where far is the false alarm rate (i.e., the proportion of non-speech incorrectly classified as speech) and missr is the miss rate (i.e., the proportion of speech incorrectly classified as non-speech.
- Parameters:
collar (float, optional) – Duration (in seconds) of collars removed from evaluation around boundaries of reference segments (one half before, one half after). Defaults to 0.0.
skip_overlap (bool, optional) – Set to True to not evaluate overlap regions. Defaults to False (i.e. keep overlap regions).
fa_weight (float, optional) – Weight for false alarm rate. Defaults to 0.25.
miss_weight (float, optional) – Weight for miss rate. Defaults to 0.75.
kwargs – Keyword arguments passed to
pyannote.metrics.base.BaseMetric.
References
“OpenSAT19 Evaluation Plan v2.” https://www.nist.gov/system/files/documents/2018/11/05/opensat19_evaluation_plan_v2_11-5-18.pdf
- compute_components(reference: Annotation, hypothesis: Annotation, uem: Timeline | None = None, **kwargs) Dict[str, float][source]
Compute metric components
- Parameters:
reference (type depends on the metric) – Manual reference
hypothesis (same as reference) – Evaluated hypothesis
- Returns:
components – Dictionary where keys are component names and values are component values
- Return type:
- class pyannote.metrics.detection.DetectionErrorRate(collar: float = 0.0, skip_overlap: bool = False, **kwargs)[source]
Detection error rate
This metric can be used to evaluate binary classification tasks such as speech activity detection, for instance. Inputs are expected to only contain segments corresponding to the positive class (e.g. speech regions). Gaps in the inputs considered as the negative class (e.g. non-speech regions).
It is computed as (fa + miss) / total, where fa is the duration of false alarm (e.g. non-speech classified as speech), miss is the duration of missed detection (e.g. speech classified as non-speech), and total is the total duration of the positive class in the reference.
- Parameters:
- compute_components(reference: Annotation, hypothesis: Annotation, uem: Timeline | None = None, **kwargs) Dict[str, float][source]
Compute metric components
- Parameters:
reference (type depends on the metric) – Manual reference
hypothesis (same as reference) – Evaluated hypothesis
- Returns:
components – Dictionary where keys are component names and values are component values
- Return type:
- class pyannote.metrics.detection.DetectionPrecision(collar: float = 0.0, skip_overlap: bool = False, **kwargs)[source]
Detection precision
This metric can be used to evaluate binary classification tasks such as speech activity detection, for instance. Inputs are expected to only contain segments corresponding to the positive class (e.g. speech regions). Gaps in the inputs considered as the negative class (e.g. non-speech regions).
It is computed as tp / (tp + fp), where tp is the duration of true positive (e.g. speech classified as speech), and fp is the duration of false positive (e.g. non-speech classified as speech).
- Parameters:
- compute_components(reference: Annotation, hypothesis: Annotation, uem: Timeline | None = None, **kwargs) Dict[str, float][source]
Compute metric components
- Parameters:
reference (type depends on the metric) – Manual reference
hypothesis (same as reference) – Evaluated hypothesis
- Returns:
components – Dictionary where keys are component names and values are component values
- Return type:
- class pyannote.metrics.detection.DetectionPrecisionRecallFMeasure(collar: float = 0.0, skip_overlap: bool = False, beta: float = 1.0, **kwargs)[source]
Compute detection precision and recall, and return their F-score
- Parameters:
collar (float, optional) – Duration (in seconds) of collars removed from evaluation around boundaries of reference segments (one half before, one half after).
skip_overlap (bool, optional) – Set to True to not evaluate overlap regions. Defaults to False (i.e. keep overlap regions).
beta (float, optional) – When beta > 1, greater importance is given to recall. When beta < 1, greater importance is given to precision. Defaults to 1.
See also
pyannote.metrics.detection.DetectionPrecision,pyannote.metrics.detection.DetectionRecall,pyannote.metrics.base.f_measure- compute_components(reference: Annotation, hypothesis: Annotation, uem: Timeline | None = None, **kwargs) Dict[str, float][source]
Compute metric components
- Parameters:
reference (type depends on the metric) – Manual reference
hypothesis (same as reference) – Evaluated hypothesis
- Returns:
components – Dictionary where keys are component names and values are component values
- Return type:
- class pyannote.metrics.detection.DetectionRecall(collar: float = 0.0, skip_overlap: bool = False, **kwargs)[source]
Detection recall
This metric can be used to evaluate binary classification tasks such as speech activity detection, for instance. Inputs are expected to only contain segments corresponding to the positive class (e.g. speech regions). Gaps in the inputs considered as the negative class (e.g. non-speech regions).
It is computed as tp / (tp + fn), where tp is the duration of true positive (e.g. speech classified as speech), and fn is the duration of false negative (e.g. speech classified as non-speech).
- Parameters:
- compute_components(reference: Annotation, hypothesis: Annotation, uem: Timeline | None = None, **kwargs) Dict[str, float][source]
Compute metric components
- Parameters:
reference (type depends on the metric) – Manual reference
hypothesis (same as reference) – Evaluated hypothesis
- Returns:
components – Dictionary where keys are component names and values are component values
- Return type:
Segmentation
Change detection modules can be evaluated using two pairs of dual metrics: precision and recall, or purity and coverage.
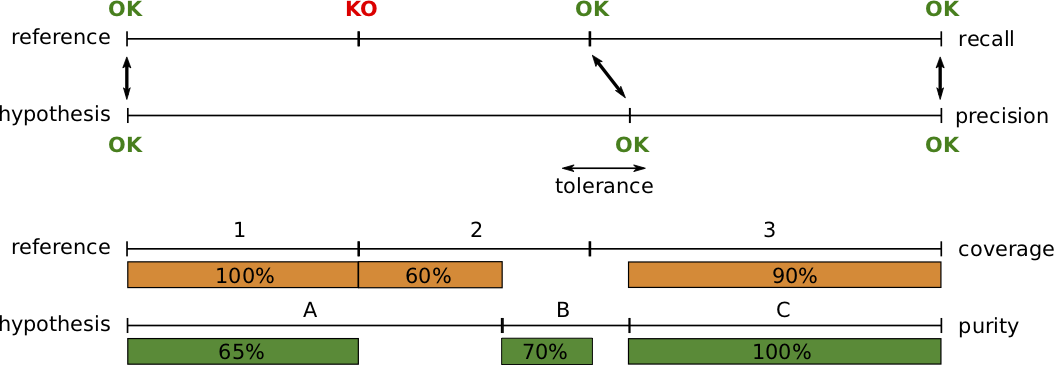
Precision and recall are standard metrics based on the number of correctly detected speaker boundaries. Recall is 75% because 3 out of 4 reference boundaries were correctly detected, and precision is 100% because all hypothesized boundaries are correct.
The main weakness of that pair of metrics (and their combination into a f-score) is that it is very sensitive to the tolerance parameter, i.e. the maximum distance between two boundaries for them to be matched. From one segmentation paper to another, authors may used very different values, thus making the approaches difficult to compare.
Instead, we think that segment-wise purity and coverage should be used instead. They have several advantages over precision and recall, including the fact that they do not depend on any tolerance parameter, and that they directly relate to the cluster-wise purity and coverage used for evaluating speaker diarization.
Segment-wise coverage is computed for each segment in the reference as the ratio of the duration of the intersection with the most co-occurring hypothesis segment and the duration of the reference segment. For instance, coverage for reference segment 1 is 100% because it is entirely covered by hypothesis segment A.
Purity is the dual metric that indicates how pure hypothesis segments are. For instance, segment A is only 65% pure because it is covered at 65% by segment 1 and 35% by segment 2.
The final values are duration-weighted average over each segment.
- class pyannote.metrics.segmentation.SegmentationCoverage(tolerance: float = 0.5, **kwargs)[source]
Segmentation coverage
- Parameters:
tolerance (float, optional) – When provided, preprocess reference by filling intra-label gaps shorter than tolerance (in seconds).
- compute_components(reference: Annotation, hypothesis: Annotation | Timeline, **kwargs)[source]
Compute metric components
- Parameters:
reference (type depends on the metric) – Manual reference
hypothesis (same as reference) – Evaluated hypothesis
- Returns:
components – Dictionary where keys are component names and values are component values
- Return type:
- class pyannote.metrics.segmentation.SegmentationPrecision(tolerance=0.0, **kwargs)[source]
Segmentation precision
>>> from pyannote.core import Timeline, Segment
>>> from pyannote.metrics.segmentation import SegmentationPrecision
>>> precision = SegmentationPrecision()
>>> reference = Timeline()
>>> reference.add(Segment(0, 1))
>>> reference.add(Segment(1, 2))
>>> reference.add(Segment(2, 4))
>>> hypothesis = Timeline()
>>> hypothesis.add(Segment(0, 1))
>>> hypothesis.add(Segment(1, 2))
>>> hypothesis.add(Segment(2, 3))
>>> hypothesis.add(Segment(3, 4))
>>> precision(reference, hypothesis)
0.6666666666666666
>>> hypothesis = Timeline()
>>> hypothesis.add(Segment(0, 4))
>>> precision(reference, hypothesis)
1.0
- compute_components(reference: Annotation | Timeline, hypothesis: Annotation | Timeline, **kwargs) Dict[str, float][source]
Compute metric components
- Parameters:
reference (type depends on the metric) – Manual reference
hypothesis (same as reference) – Evaluated hypothesis
- Returns:
components – Dictionary where keys are component names and values are component values
- Return type:
- class pyannote.metrics.segmentation.SegmentationPurity(tolerance: float = 0.5, **kwargs)[source]
Segmentation purity
- Parameters:
tolerance (float, optional) – When provided, preprocess reference by filling intra-label gaps shorter than tolerance (in seconds).
- compute_components(reference: Annotation, hypothesis: Annotation | Timeline, **kwargs) Dict[str, float][source]
Compute metric components
- Parameters:
reference (type depends on the metric) – Manual reference
hypothesis (same as reference) – Evaluated hypothesis
- Returns:
components – Dictionary where keys are component names and values are component values
- Return type:
- class pyannote.metrics.segmentation.SegmentationPurityCoverageFMeasure(tolerance=0.5, beta=1, **kwargs)[source]
Compute segmentation purity and coverage, and return their F-score.
- Parameters:
See also
pyannote.metrics.segmentation.SegmentationPurity,pyannote.metrics.segmentation.SegmentationCoverage,pyannote.metrics.base.f_measure- compute_components(reference: Annotation, hypothesis: Annotation | Timeline, **kwargs) Dict[str, float][source]
Compute metric components
- Parameters:
reference (type depends on the metric) – Manual reference
hypothesis (same as reference) – Evaluated hypothesis
- Returns:
components – Dictionary where keys are component names and values are component values
- Return type:
- class pyannote.metrics.segmentation.SegmentationRecall(tolerance=0.0, **kwargs)[source]
Segmentation recall
>>> from pyannote.core import Timeline, Segment
>>> from pyannote.metrics.segmentation import SegmentationRecall
>>> recall = SegmentationRecall()
>>> reference = Timeline()
>>> reference.add(Segment(0, 1))
>>> reference.add(Segment(1, 2))
>>> reference.add(Segment(2, 4))
>>> hypothesis = Timeline()
>>> hypothesis.add(Segment(0, 1))
>>> hypothesis.add(Segment(1, 2))
>>> hypothesis.add(Segment(2, 3))
>>> hypothesis.add(Segment(3, 4))
>>> recall(reference, hypothesis)
1.0
>>> hypothesis = Timeline()
>>> hypothesis.add(Segment(0, 4))
>>> recall(reference, hypothesis)
0.0
- compute_components(reference: Annotation | Timeline, hypothesis: Annotation | Timeline, **kwargs) Dict[str, float][source]
Compute metric components
- Parameters:
reference (type depends on the metric) – Manual reference
hypothesis (same as reference) – Evaluated hypothesis
- Returns:
components – Dictionary where keys are component names and values are component values
- Return type:
Diarization
Diarization error rate (DER) is the de facto standard metric for evaluating and comparing speaker diarization systems. It is defined as follows:
where \(\text{false alarm}\) is the duration of non-speech incorrectly classified as speech, \(\text{missed detection}\) is the duration of speech incorrectly classified as non-speech, \(\text{confusion}\) is the duration of speaker confusion, and \(\text{total}\) is the sum over all speakers of their reference speech duration.
Note that this metric does take overlapping speech into account, potentially leading to increased missed detection in case the speaker diarization system does not include an overlapping speech detection module.
Optimal vs. greedy
Two implementations of the diarization error rate are available (optimal and greedy), depending on how the one-to-one mapping between reference and hypothesized speakers is computed.
The optimal version uses the Hungarian algorithm to compute the mapping that minimize the confusion term, while the greedy version operates in a greedy manner, mapping reference and hypothesized speakers iteratively, by decreasing value of their co-occurrence duration.
In practice, the greedy version is much faster than the optimal one, especially for files with a large number of speakers – though it may slightly over-estimate the value of the diarization error rate.
Purity and coverage
While the diarization error rate provides a convenient way to compare different diarization approaches, it is usually not enough to understand the type of errors committed by the system.
Purity and coverage are two dual evaluation metrics that provide additional insight on the behavior of the system.
where \(|\text{speaker}|\) (respectively \(|\text{cluster}|\)) is the speech duration of this particular reference speaker (resp. hypothesized cluster), and \(|\text{speaker} \cap \text{cluster}|\) is the duration of their intersection.
Over-segmented results (e.g. too many speaker clusters) tend to lead to high purity and low coverage, while under-segmented results (e.g. when two speakers are merged into one large cluster) lead to low purity and higher coverage.
Use case
This figure depicts the evolution of a multi-stage speaker diarization system applied on the ETAPE dataset. It is roughly made of four consecutive modules (segmentation, BIC clustering, Viterbi resegmentation, and CLR clustering).
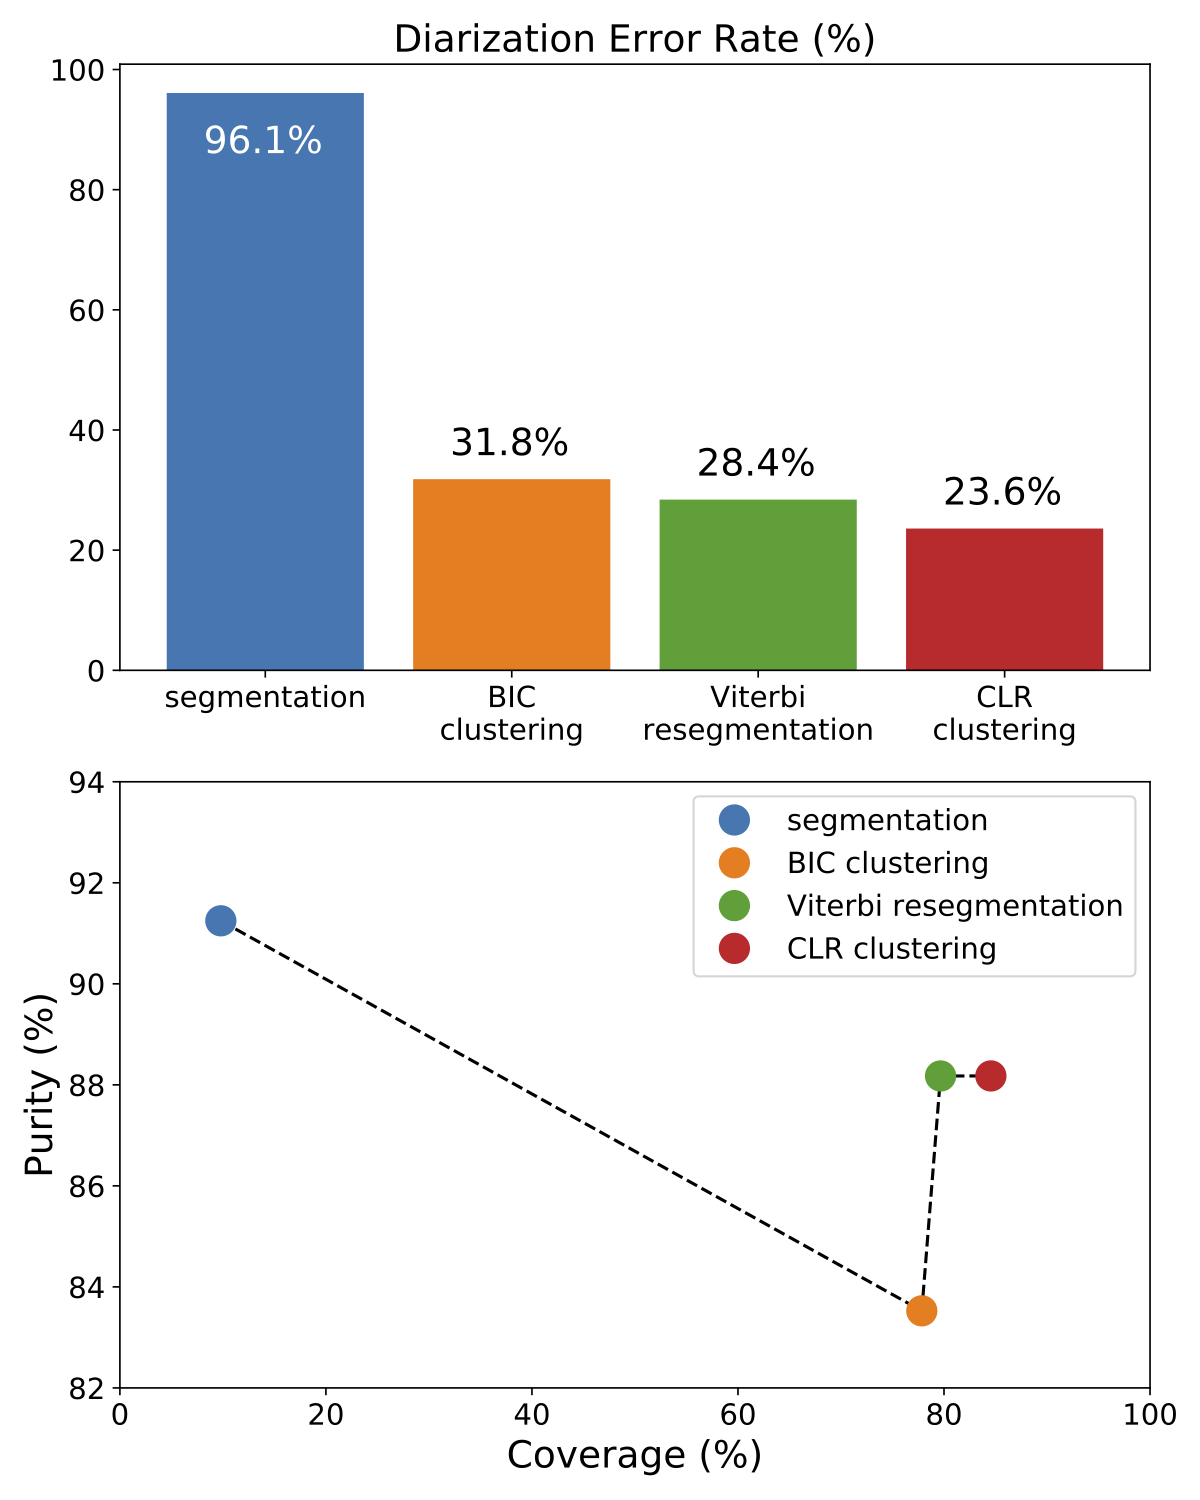
From the upper part of the figure (DER as a function of the module), it is clear that each module improves the output of the previous one.
Yet, the lower part of the figure clarifies the role of each module. BIC clustering tends to increase the size of the speaker clusters, at the expense of purity (-7%). Viterbi resegmentation addresses this limitation and greatly improves cluster purity (+5%), with very little impact on the actual cluster coverage (+2%). Finally, CLR clustering brings an additional +5% coverage improvement.
Metrics for diarization
- class pyannote.metrics.diarization.DiarizationCompleteness(collar: float = 0.0, skip_overlap: bool = False, **kwargs)[source]
Cluster completeness
- Parameters:
- compute_components(reference: Annotation, hypothesis: Annotation, uem: Timeline | None = None, **kwargs) Dict[str, float][source]
Compute metric components
- Parameters:
reference (type depends on the metric) – Manual reference
hypothesis (same as reference) – Evaluated hypothesis
- Returns:
components – Dictionary where keys are component names and values are component values
- Return type:
- class pyannote.metrics.diarization.DiarizationCoverage(**kwargs)[source]
Cluster coverage
A hypothesized annotation has perfect coverage if all segments from a given reference label are assigned to the same cluster.
- compute_components(reference: Annotation, hypothesis: Annotation, uem: Timeline | None = None, **kwargs) Dict[str, float][source]
Compute metric components
- Parameters:
reference (type depends on the metric) – Manual reference
hypothesis (same as reference) – Evaluated hypothesis
- Returns:
components – Dictionary where keys are component names and values are component values
- Return type:
- class pyannote.metrics.diarization.DiarizationErrorRate(collar: float = 0.0, skip_overlap: bool = False, **kwargs)[source]
Diarization error rate
First, the optimal mapping between reference and hypothesis labels is obtained using the Hungarian algorithm. Then, the actual diarization error rate is computed as the identification error rate with each hypothesis label translated into the corresponding reference label.
- Parameters:
Examples
Diarization error rate between reference and hypothesis annotations
>>> metric = DiarizationErrorRate()
>>> reference = Annotation(...)
>>> hypothesis = Annotation(...)
>>> value = metric(reference, hypothesis)
Compute global diarization error rate and confidence interval over multiple documents
>>> for reference, hypothesis in ...
...    metric(reference, hypothesis)
>>> global_value = abs(metric)
>>> mean, (lower, upper) = metric.confidence_interval()
Get diarization error rate detailed components
>>> components = metric(reference, hypothesis, detailed=True) #doctest +SKIP
Get accumulated components
>>> components = metric[:]
>>> metric['confusion']
See also
pyannote.metric.base.BaseMetricdetails on accumulation
pyannote.metric.identification.IdentificationErrorRateidentification error rate
- compute_components(reference: Annotation, hypothesis: Annotation, uem: Timeline | None = None, **kwargs) Dict[str, float][source]
- Parameters:
See also
pyannote.metric.diarization.DiarizationErrorRate,two
- optimal_mapping(reference: Annotation, hypothesis: Annotation, uem: Timeline | None = None) Dict[Hashable, Hashable][source]
Optimal label mapping
- Parameters:
reference (Annotation)
hypothesis (Annotation) – Reference and hypothesis diarization
uem (Timeline) – Evaluation map
- Returns:
mapping – Mapping between hypothesis (key) and reference (value) labels
- Return type:
- class pyannote.metrics.diarization.DiarizationHomogeneity(collar: float = 0.0, skip_overlap: bool = False, **kwargs)[source]
Cluster homogeneity
- Parameters:
- compute_components(reference: Annotation, hypothesis: Annotation, uem: Timeline | None = None, **kwargs) Dict[str, float][source]
Compute metric components
- Parameters:
reference (type depends on the metric) – Manual reference
hypothesis (same as reference) – Evaluated hypothesis
- Returns:
components – Dictionary where keys are component names and values are component values
- Return type:
- class pyannote.metrics.diarization.DiarizationPurity(**kwargs)[source]
Cluster purity
A hypothesized annotation has perfect purity if all of its labels overlap only segments which are members of a single reference label.
- compute_components(reference: Annotation, hypothesis: Annotation, uem: Timeline | None = None, **kwargs) Dict[str, float][source]
Compute metric components
- Parameters:
reference (type depends on the metric) – Manual reference
hypothesis (same as reference) – Evaluated hypothesis
- Returns:
components – Dictionary where keys are component names and values are component values
- Return type:
- class pyannote.metrics.diarization.GreedyDiarizationErrorRate(collar: float = 0.0, skip_overlap: bool = False, **kwargs)[source]
Greedy diarization error rate
First, the greedy mapping between reference and hypothesis labels is obtained. Then, the actual diarization error rate is computed as the identification error rate with each hypothesis label translated into the corresponding reference label.
- Parameters:
Examples
Greedy diarization error rate between reference and hypothesis annotations
>>> metric = GreedyDiarizationErrorRate()
>>> reference = Annotation(...)
>>> hypothesis = Annotation(...)
>>> value = metric(reference, hypothesis)
Compute global greedy diarization error rate and confidence interval over multiple documents
>>> for reference, hypothesis in ...
...    metric(reference, hypothesis)
>>> global_value = abs(metric)
>>> mean, (lower, upper) = metric.confidence_interval()
Get greedy diarization error rate detailed components
>>> components = metric(reference, hypothesis, detailed=True) #doctest +SKIP
Get accumulated components
>>> components = metric[:]
>>> metric['confusion']
See also
pyannote.metric.base.BaseMetricdetails on accumulation
- compute_components(reference: Annotation, hypothesis: Annotation, uem: Timeline | None = None, **kwargs) Dict[str, float][source]
- Parameters:
See also
pyannote.metric.diarization.DiarizationErrorRate,two
- greedy_mapping(reference: Annotation, hypothesis: Annotation, uem: Timeline | None = None) Dict[Hashable, Hashable][source]
Greedy label mapping
- Parameters:
reference (Annotation)
hypothesis (Annotation) – Reference and hypothesis diarization
uem (Timeline) – Evaluation map
- Returns:
mapping – Mapping between hypothesis (key) and reference (value) labels
- Return type:
- class pyannote.metrics.diarization.JaccardErrorRate(collar=0.0, skip_overlap=False, **kwargs)[source]
Jaccard error rate
- Parameters:
Examples
>>> metric = JaccardErrorRate()
>>> reference = Annotation(...)
>>> hypothesis = Annotation(...)
>>> jer = metric(reference, hypothesis)
Reference
Second DIHARD Challenge Evaluation Plan. Version 1.1 N. Ryant, K. Church, C. Cieri, A. Cristia, J. Du, S. Ganapathy, M. Liberman https://coml.lscp.ens.fr/dihard/2019/second_dihard_eval_plan_v1.1.pdf
“The Jaccard error rate is based on the Jaccard index, a similarity measure used to evaluate the output of image segmentation systems. An optimal mapping between reference and system speakers is determined and for each pair the Jaccard index is computed. The Jaccard error rate is then defined as 1 minus the average of these scores. While similar to DER, it weights every speaker’s contribution equally, regardless of how much speech they actually produced.
More concretely, assume we have N reference speakers and M system speakers. An optimal mapping between speakers is determined using the Hungarian algorithm so that each reference speaker is paired with at most one system speaker and each system speaker with at most one reference speaker. Then, for each reference speaker ref the speaker-specific Jaccard error rate JERref is computed as JERref = (FA + MISS) / TOTAL where
TOTAL is the duration of the union of reference and system speaker segments; if the reference speaker was not paired with a system speaker, it is the duration of all reference speaker segments
FA is the total system speaker time not attributed to the reference speaker; if the reference speaker was not paired with a system speaker, it is 0
MISS is the total reference speaker time not attributed to the system speaker; if the reference speaker was not paired with a system speaker, it is equal to TOTAL
The Jaccard error rate then is the average of the speaker specific Jaccard error rates.
JER and DER are highly correlated with JER typically being higher, especially in recordings where one or more speakers is particularly dominant. Where it tends to track DER is in outliers where the diarization is especially bad, resulting in one or more unmapped system speakers whose speech is not then penalized. In these cases, where DER can easily exceed 500%, JER will never exceed 100% and may be far lower if the reference speakers are handled correctly.”
- compute_components(reference: Annotation, hypothesis: Annotation, uem: Timeline | None = None, **kwargs) Dict[str, float][source]
- Parameters:
See also
pyannote.metric.diarization.DiarizationErrorRate,two
Identification
In case prior speaker models are available, the speech turn clustering module may be followed by a supervised speaker recognition module for cluster-wise supervised classification.
pyannote.metrics also provides a collection of evaluation metrics for this identification task. This includes precision, recall, and identification error rate (IER):
which is similar to the diarization error rate (DER) introduced previously, except that the \(\texttt{confusion}\) term is computed directly by comparing reference and hypothesis labels, and does not rely on a prior one-to-one matching.
- class pyannote.metrics.identification.IdentificationErrorRate(confusion: float = 1.0, miss: float = 1.0, false_alarm: float = 1.0, collar: float = 0.0, skip_overlap: bool = False, **kwargs)[source]
Identification error rate
ier = (wc x confusion + wf x false_alarm + wm x miss) / total- where
confusion is the total confusion duration in seconds
false_alarm is the total hypothesis duration where there are
miss is
total is the total duration of all tracks
wc, wf and wm are optional weights (default to 1)
- Parameters:
collar (float, optional) – Duration (in seconds) of collars removed from evaluation around boundaries of reference segments.
skip_overlap (bool, optional) – Set to True to not evaluate overlap regions. Defaults to False (i.e. keep overlap regions).
confusion (float, optional) – Optional weights for confusion, miss and false alarm respectively. Default to 1. (no weight)
miss (float, optional) – Optional weights for confusion, miss and false alarm respectively. Default to 1. (no weight)
false_alarm (float, optional) – Optional weights for confusion, miss and false alarm respectively. Default to 1. (no weight)
- class pyannote.metrics.identification.IdentificationPrecision(collar: float = 0.0, skip_overlap: bool = False, **kwargs)[source]
Identification Precision
- Parameters:
- compute_components(reference: Annotation, hypothesis: Annotation, uem: Timeline | None = None, **kwargs) Dict[str, float][source]
Compute metric components
- Parameters:
reference (type depends on the metric) – Manual reference
hypothesis (same as reference) – Evaluated hypothesis
- Returns:
components – Dictionary where keys are component names and values are component values
- Return type:
- class pyannote.metrics.identification.IdentificationRecall(collar: float = 0.0, skip_overlap: bool = False, **kwargs)[source]
Identification Recall
- Parameters:
- compute_components(reference: Annotation, hypothesis: Annotation, uem: Timeline | None = None, **kwargs) Dict[str, float][source]
Compute metric components
- Parameters:
reference (type depends on the metric) – Manual reference
hypothesis (same as reference) – Evaluated hypothesis
- Returns:
components – Dictionary where keys are component names and values are component values
- Return type:
Error analysis
- class pyannote.metrics.errors.identification.IdentificationErrorAnalysis(collar: float = 0.0, skip_overlap: bool = False)[source]
- Parameters:
- difference(reference: Annotation, hypothesis: Annotation, uem: Timeline | None = None, uemified: bool = False)[source]
Get error analysis as Annotation
Labels are (status, reference_label, hypothesis_label) tuples. status is either ‘correct’, ‘confusion’, ‘missed detection’ or ‘false alarm’. reference_label is None in case of ‘false alarm’. hypothesis_label is None in case of ‘missed detection’.
- Parameters:
uemified (bool, optional) – Returns “uemified” version of reference and hypothesis. Defaults to False.
- Returns:
errors
- Return type:
Annotation
Plots
- pyannote.metrics.plot.binary_classification.plot_det_curve(y_true: _Buffer | _SupportsArray[dtype[Any]] | _NestedSequence[_SupportsArray[dtype[Any]]] | bool | int | float | complex | str | bytes | _NestedSequence[bool | int | float | complex | str | bytes], scores: _Buffer | _SupportsArray[dtype[Any]] | _NestedSequence[_SupportsArray[dtype[Any]]] | bool | int | float | complex | str | bytes | _NestedSequence[bool | int | float | complex | str | bytes], save_to: str, distances: bool = False, dpi: int = 150) float[source]
DET curve
- This function will create (and overwrite) the following files:
{save_to}.det.png
{save_to}.det.eps
{save_to}.det.txt
- Parameters:
- Returns:
eer – Equal error rate
- Return type:
- pyannote.metrics.plot.binary_classification.plot_distributions(y_true: _Buffer | _SupportsArray[dtype[Any]] | _NestedSequence[_SupportsArray[dtype[Any]]] | bool | int | float | complex | str | bytes | _NestedSequence[bool | int | float | complex | str | bytes], scores: _Buffer | _SupportsArray[dtype[Any]] | _NestedSequence[_SupportsArray[dtype[Any]]] | bool | int | float | complex | str | bytes | _NestedSequence[bool | int | float | complex | str | bytes], save_to: str, xlim: Tuple[float, float] | None = None, nbins: int = 100, ymax: float = 3.0, dpi: int = 150) bool[source]
Scores distributions
- This function will create (and overwrite) the following files:
{save_to}.scores.png
{save_to}.scores.eps
- Parameters:
y_true ((n_samples, ) array-like) – Boolean reference.
scores ((n_samples, ) array-like) – Predicted score.
save_to (str) – Files path prefix
- pyannote.metrics.plot.binary_classification.plot_precision_recall_curve(y_true: _Buffer | _SupportsArray[dtype[Any]] | _NestedSequence[_SupportsArray[dtype[Any]]] | bool | int | float | complex | str | bytes | _NestedSequence[bool | int | float | complex | str | bytes], scores: _Buffer | _SupportsArray[dtype[Any]] | _NestedSequence[_SupportsArray[dtype[Any]]] | bool | int | float | complex | str | bytes | _NestedSequence[bool | int | float | complex | str | bytes], save_to: str, distances: bool = False, dpi: int = 150) float[source]
Precision/recall curve
- This function will create (and overwrite) the following files:
{save_to}.precision_recall.png
{save_to}.precision_recall.eps
{save_to}.precision_recall.txt
- Parameters:
- Returns:
auc – Area under precision/recall curve
- Return type: